New from PMAP: a practical guide to vulnerability management in DevSecOpsGet the ebook >
End-to-end pipeline
How PMAP Works
Most teams run vulnerability scanning across several consoles at once, and every scanner reports findings in its own format, on its own schedule, with its own duplicates. PMAP turns that disconnected multi-vendor output into one governed pipeline, so every finding follows the same traceable path from ingest to remediation. This page walks a scan and a finding through that pipeline stage by stage.
30 vendor connectors across 9 integration categories
4-case deduplication on every imported finding
9-state finding lifecycle with audit-logged transitions
app.pmap.io/dashboard
One pipeline from scan to remediation
A scan result on its own is just raw output. It says nothing about whether the issue is new, whether it already has an owner, or whether it duplicates something another scanner already reported. PMAP closes that gap by routing every result through a single workflow. Scanner output becomes a prioritized, owned, and tracked finding instead of another line in a spreadsheet.
The pipeline has five stages: ingest, correlate and deduplicate, triage and prioritize, remediate, then report and analyze. Each stage hands clean, governed data to the next. Because the same path applies to every vendor and every tenant, the journey of any finding stays consistent and reviewable from first observation to closure.
The PMAP pipeline at a glance
Five governed stages carry every finding from raw scanner output to a measured, auditable result. Each step hands clean data to the next.
1
Ingest
Scans arrive from connected vendors and manual uploads, then sync their status live so PMAP mirrors what the scanner is actually doing.
2
Correlate and deduplicate
Every result is matched against existing findings, so one real issue becomes one record instead of many copies.
3
Triage and prioritize
Findings get governed severity, an enforced status, an owner, and an SLA, with policy rules applied at ingest time.
4
Remediate
Owned findings flow into Jira or ServiceNow with two-way sync, get fixed, then verified by re-test before closure.
5
Report and analyze
Because everything lives in one finding model, SLA, MTTR, and reopen metrics come from the same governed data with a full audit trail.
30 vendors
4-case dedup
9-state lifecycle
10x6 RBAC matrix
app.pmap.io/scans
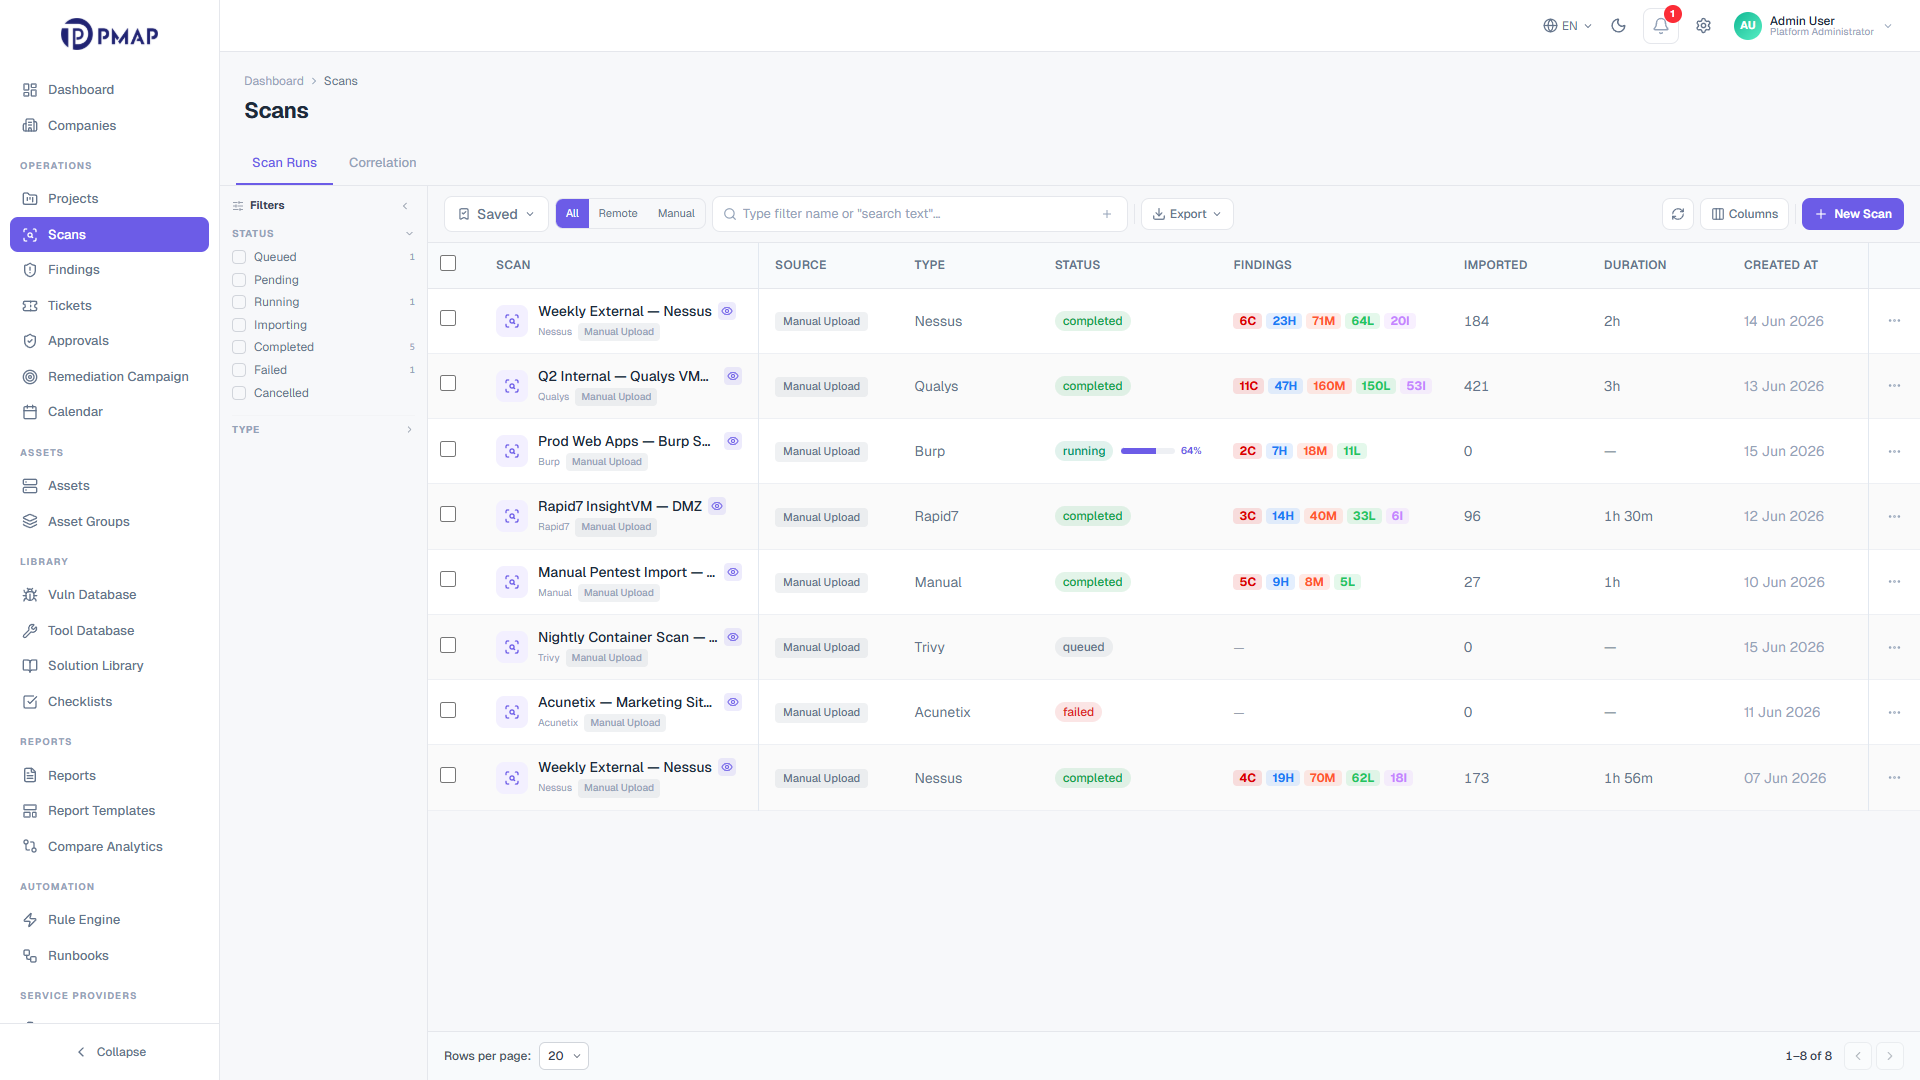
Stage 1 . Ingest
Bring every scan into one inventory
PMAP ingests scans two ways: analysts launch or upload them manually, and integration-backed scans are pulled directly from connected vendors. A 30-second background sync polls running, queued, paused, and importing scans, so progress and per-severity counts stay current on every scan page without a manual refresh. Vendor scans that exist on the scanner but not yet in PMAP are adopted automatically, which keeps the scan list a faithful mirror of each console.
Manual scans and integration-backed scans share one inventory and one detail view
Live status sync refreshes status, progress, and severity counts every 30 seconds
Orphan adoption sweeps each connected vendor every 5 minutes and pulls in missing scans
Import filters narrow what gets persisted by plugin exclusions and minimum severity
Before a result becomes a finding, PMAP asks one question: does this vulnerability already exist, or is it new? A two-stage lookup answers it. The engine checks the scanner reference key first, then falls back to a SHA-1 fingerprint built from the normalized title, asset, and endpoint. That single check decides whether to create a new finding, update an existing one, or reopen a closed one, so the same issue reported by three scanners stays one record.
Reference-key match runs first for idempotent re-ingestion of repeated scan runs
Fingerprint match catches the same issue across different scanners
A closed finding that recurs is reopened with its history preserved, not duplicated
Cross-scan wave visibility tracks how often and where each finding has been seen
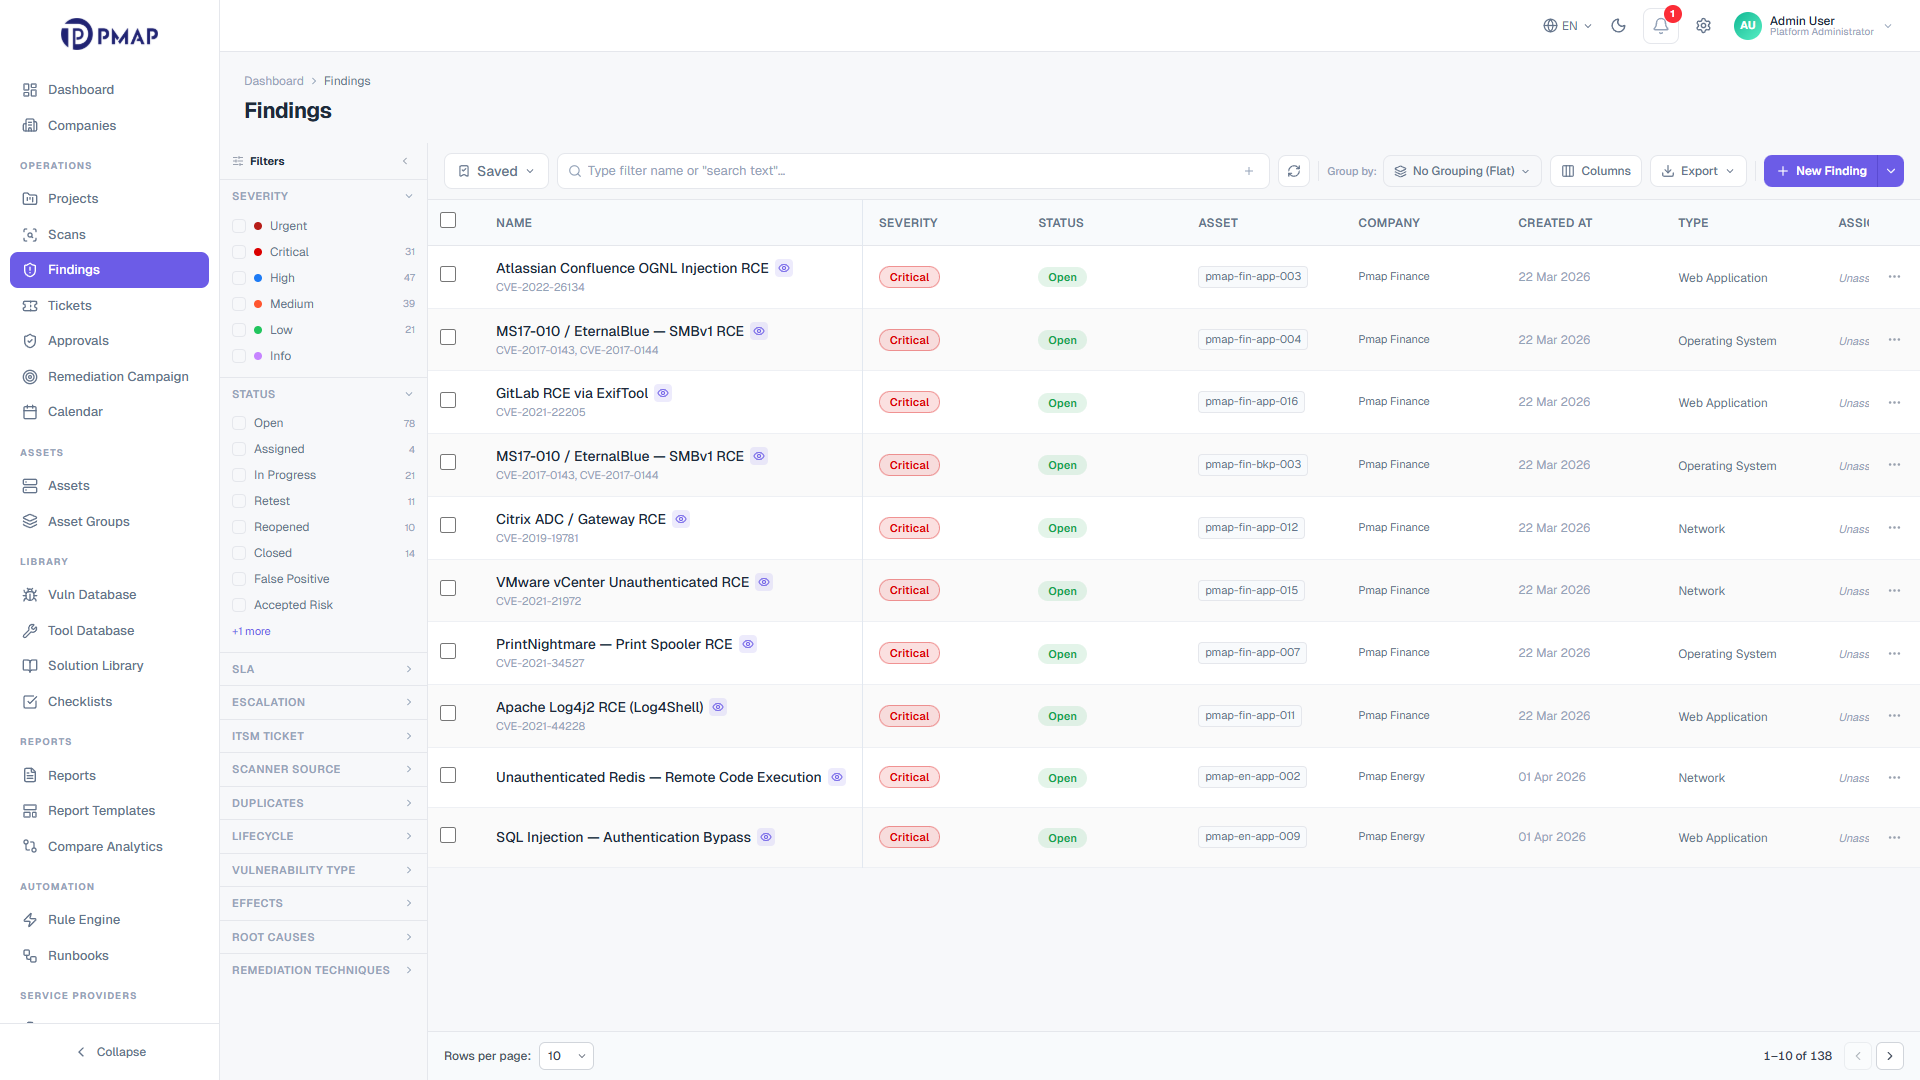
Once a finding exists, triage decides what happens to it. PMAP preserves the scanner reported severity as the original value and tracks a separate effective severity, so external severity is never trusted blindly. Status moves through an enforced state machine that only offers valid next steps, and every transition is audit-logged. A no-code rule engine applies triage policy the moment findings arrive, so analysts inherit consistent decisions instead of re-making them by hand.
Severity governance separates original scanner value from effective, adjustable severity
A 9-state status machine offers only valid next states and rejects illegal moves
Owners and SLA deadlines are assigned per finding, with pause, resume, and escalation tracking
The rule engine matches on 25+ fields with 16 operators and applies 8 action types at ingest
Sensitive status changes can require four-eyes approval before they apply
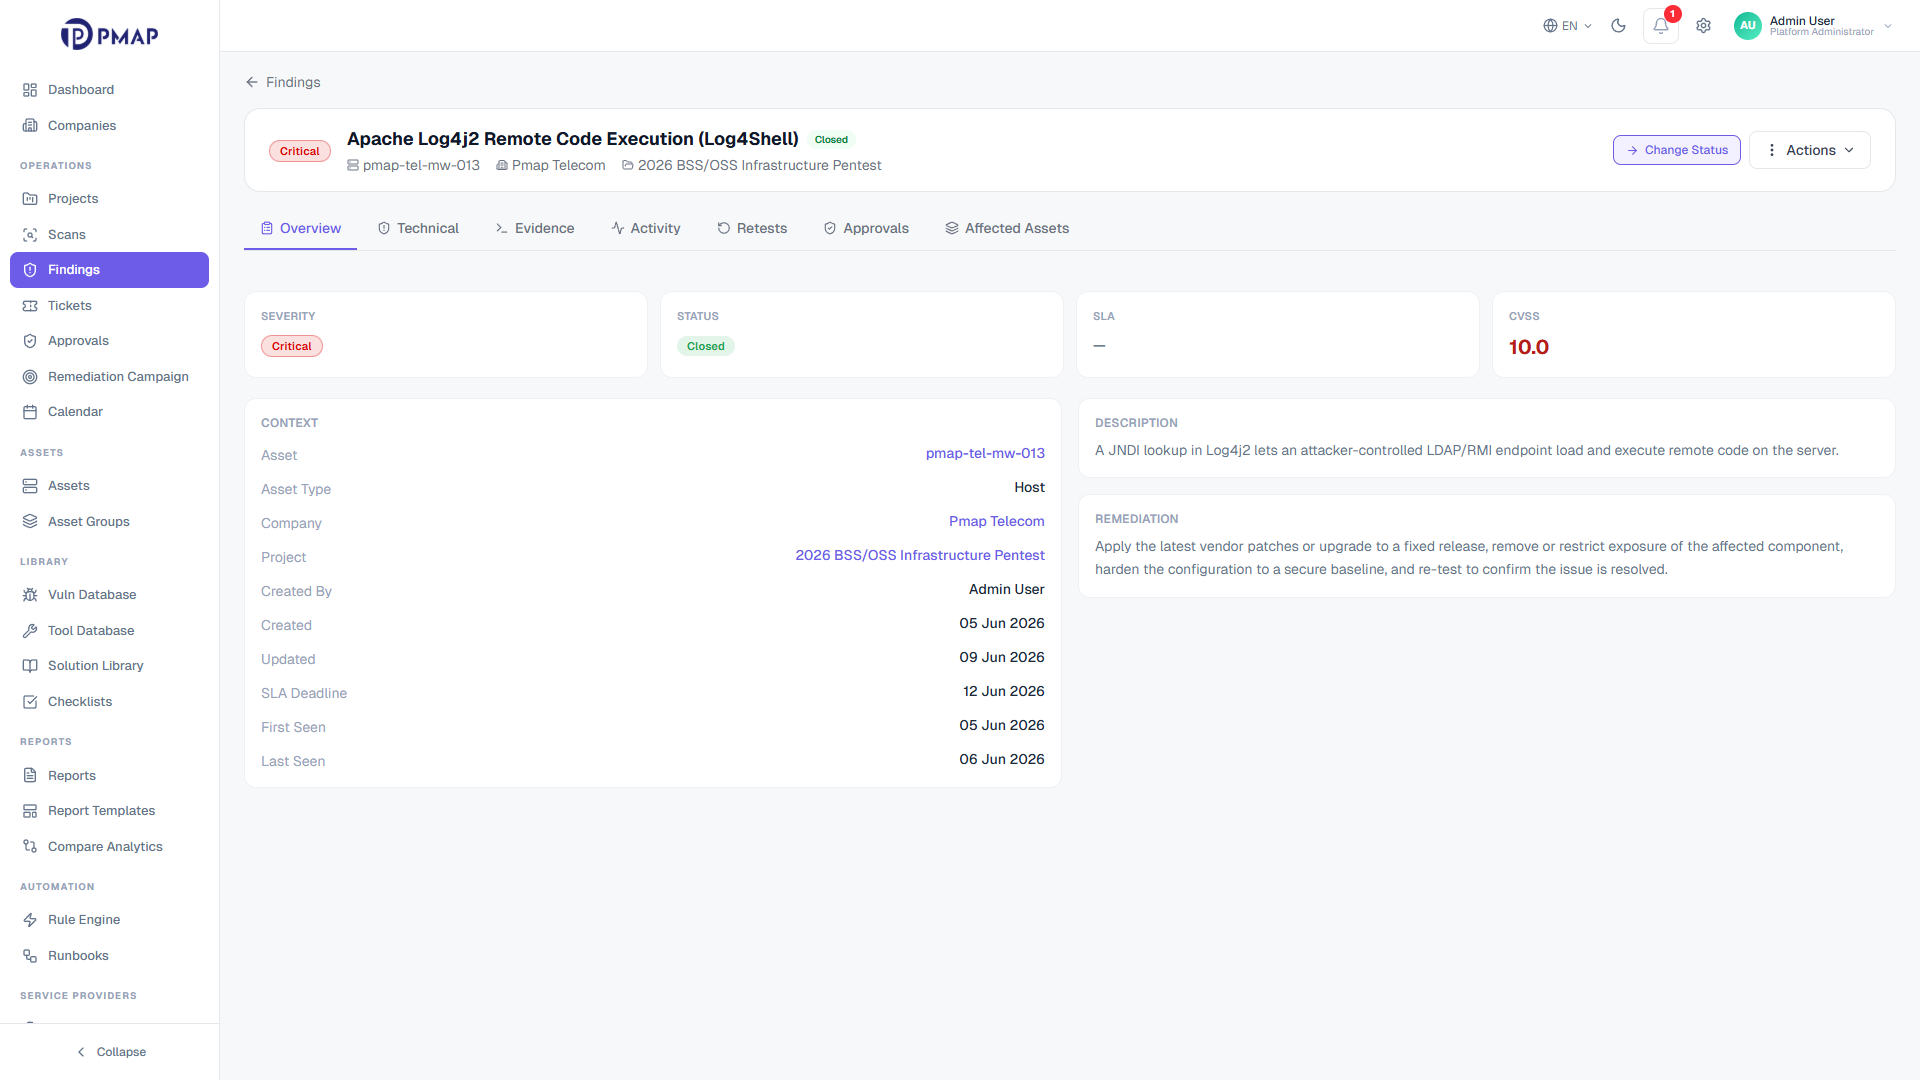
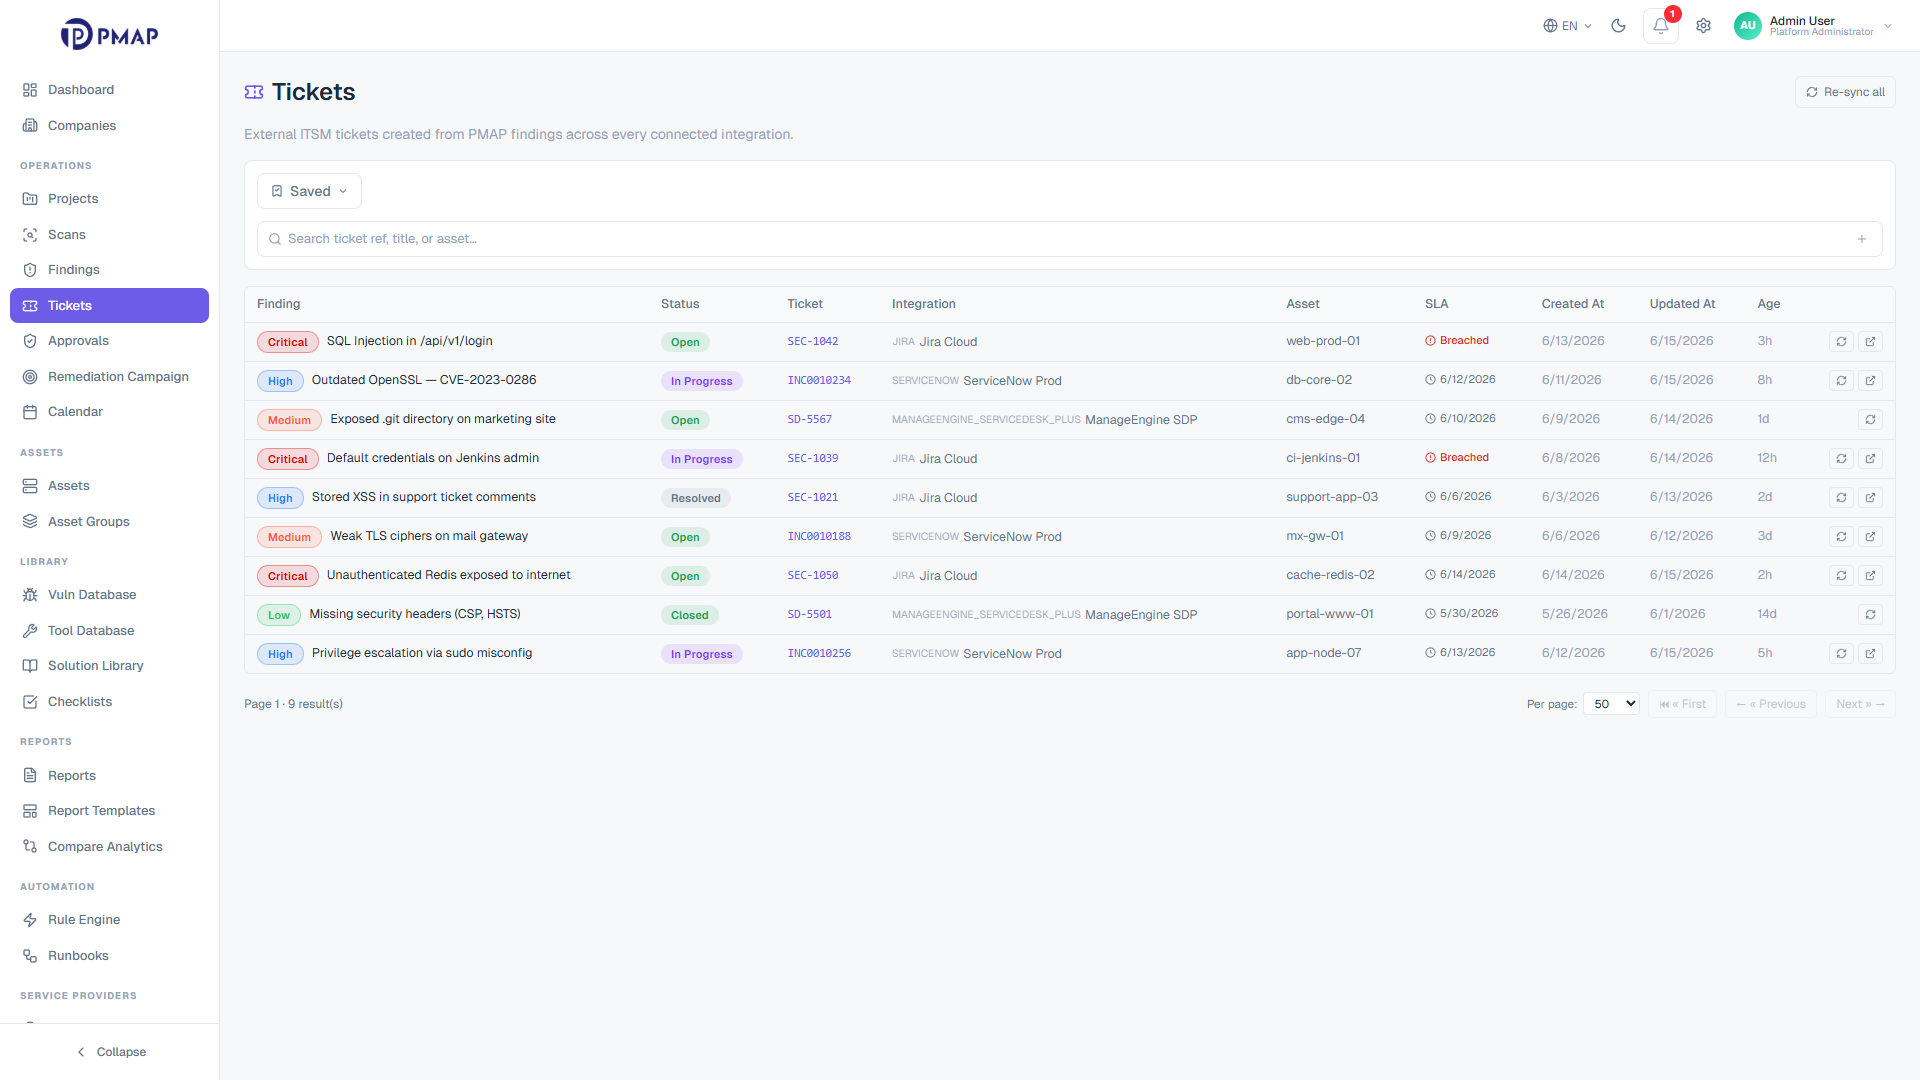
Triaged findings need to reach the people who remediate them. PMAP links findings to Jira and ServiceNow with two-way status sync, so a ticket update in the ITSM tool reflects back on the finding and the other way around. When a fix is claimed, the finding moves to re-test, and only a passed re-test moves it to closed. Remediation stays connected to the same record that was ingested and triaged, with nothing handed off into a disconnected silo.
Two-way ticket sync with Jira and ServiceNow keeps finding and ticket status aligned
Re-test is required before closure, so fixes are verified rather than assumed
Bulk ticket actions cover large selections in one operation
Notes, activity, and webhook-sourced updates stay attached to the finding
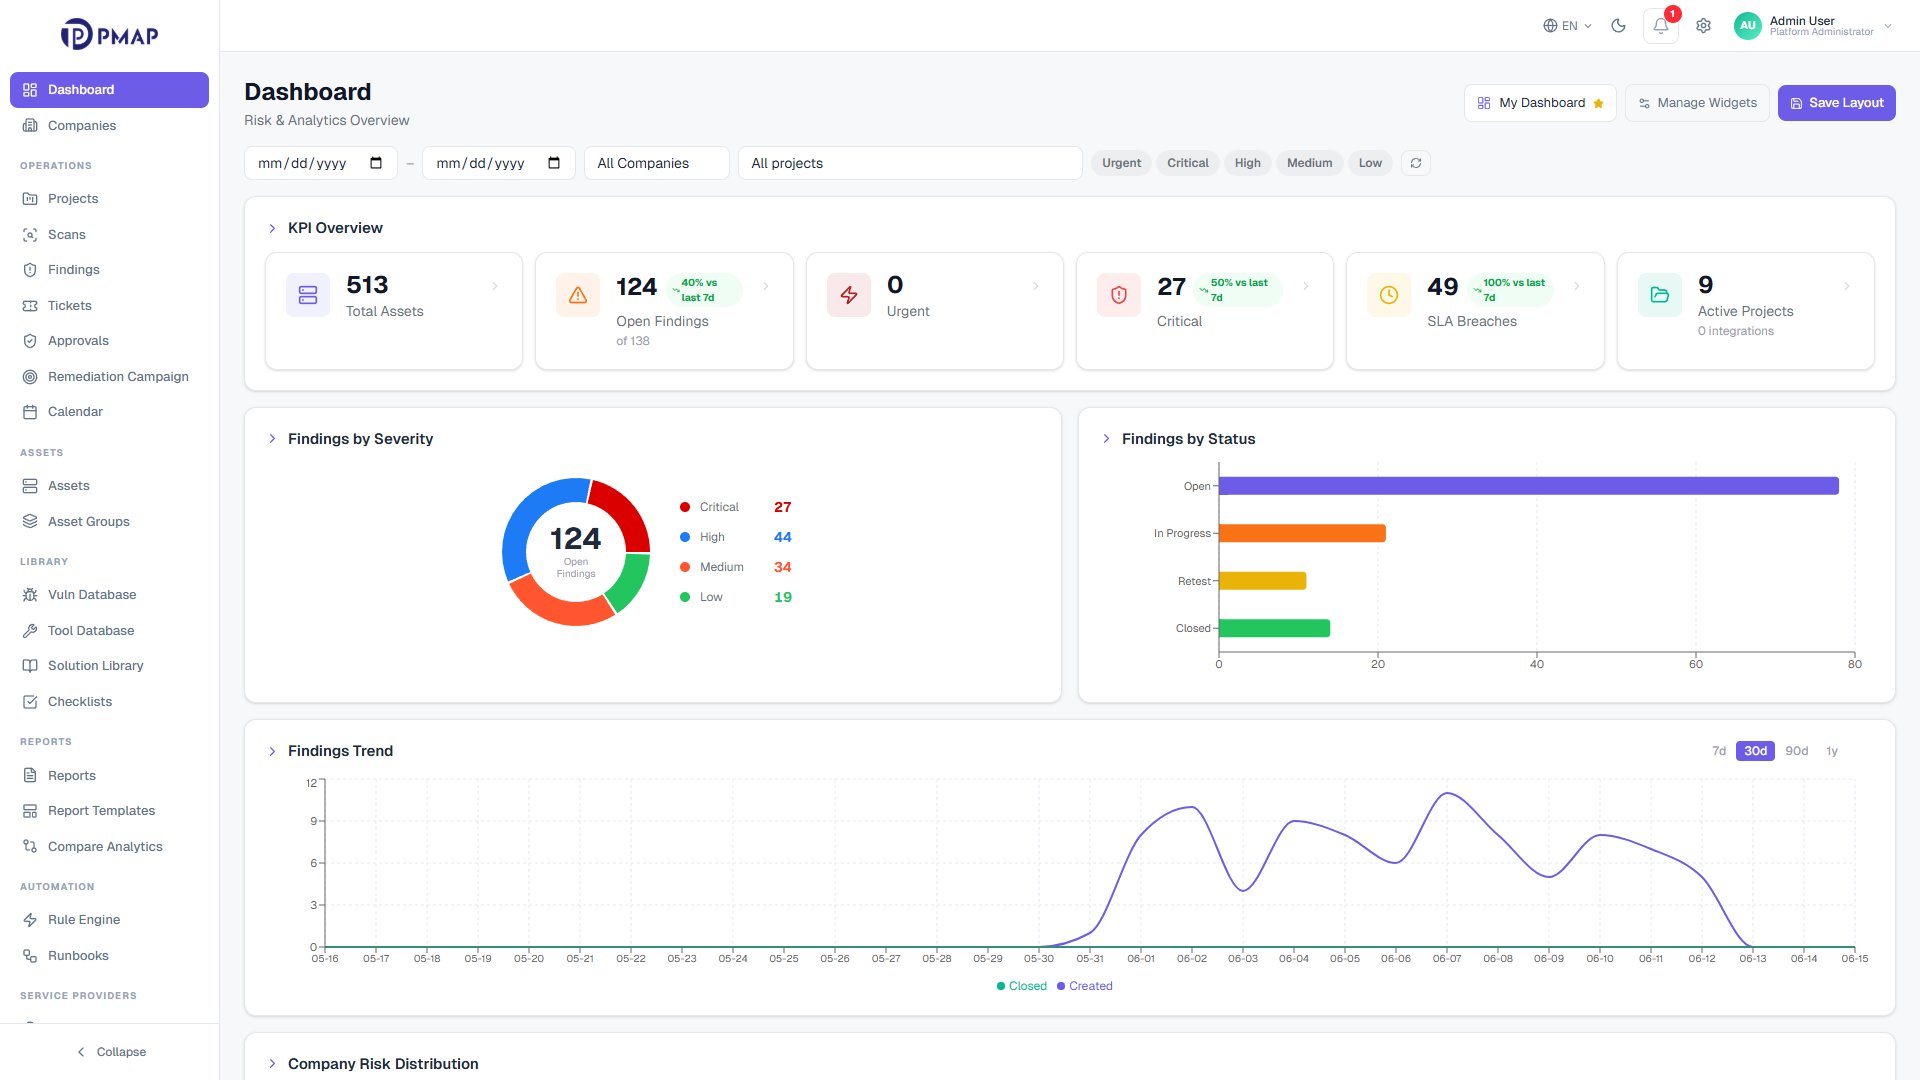
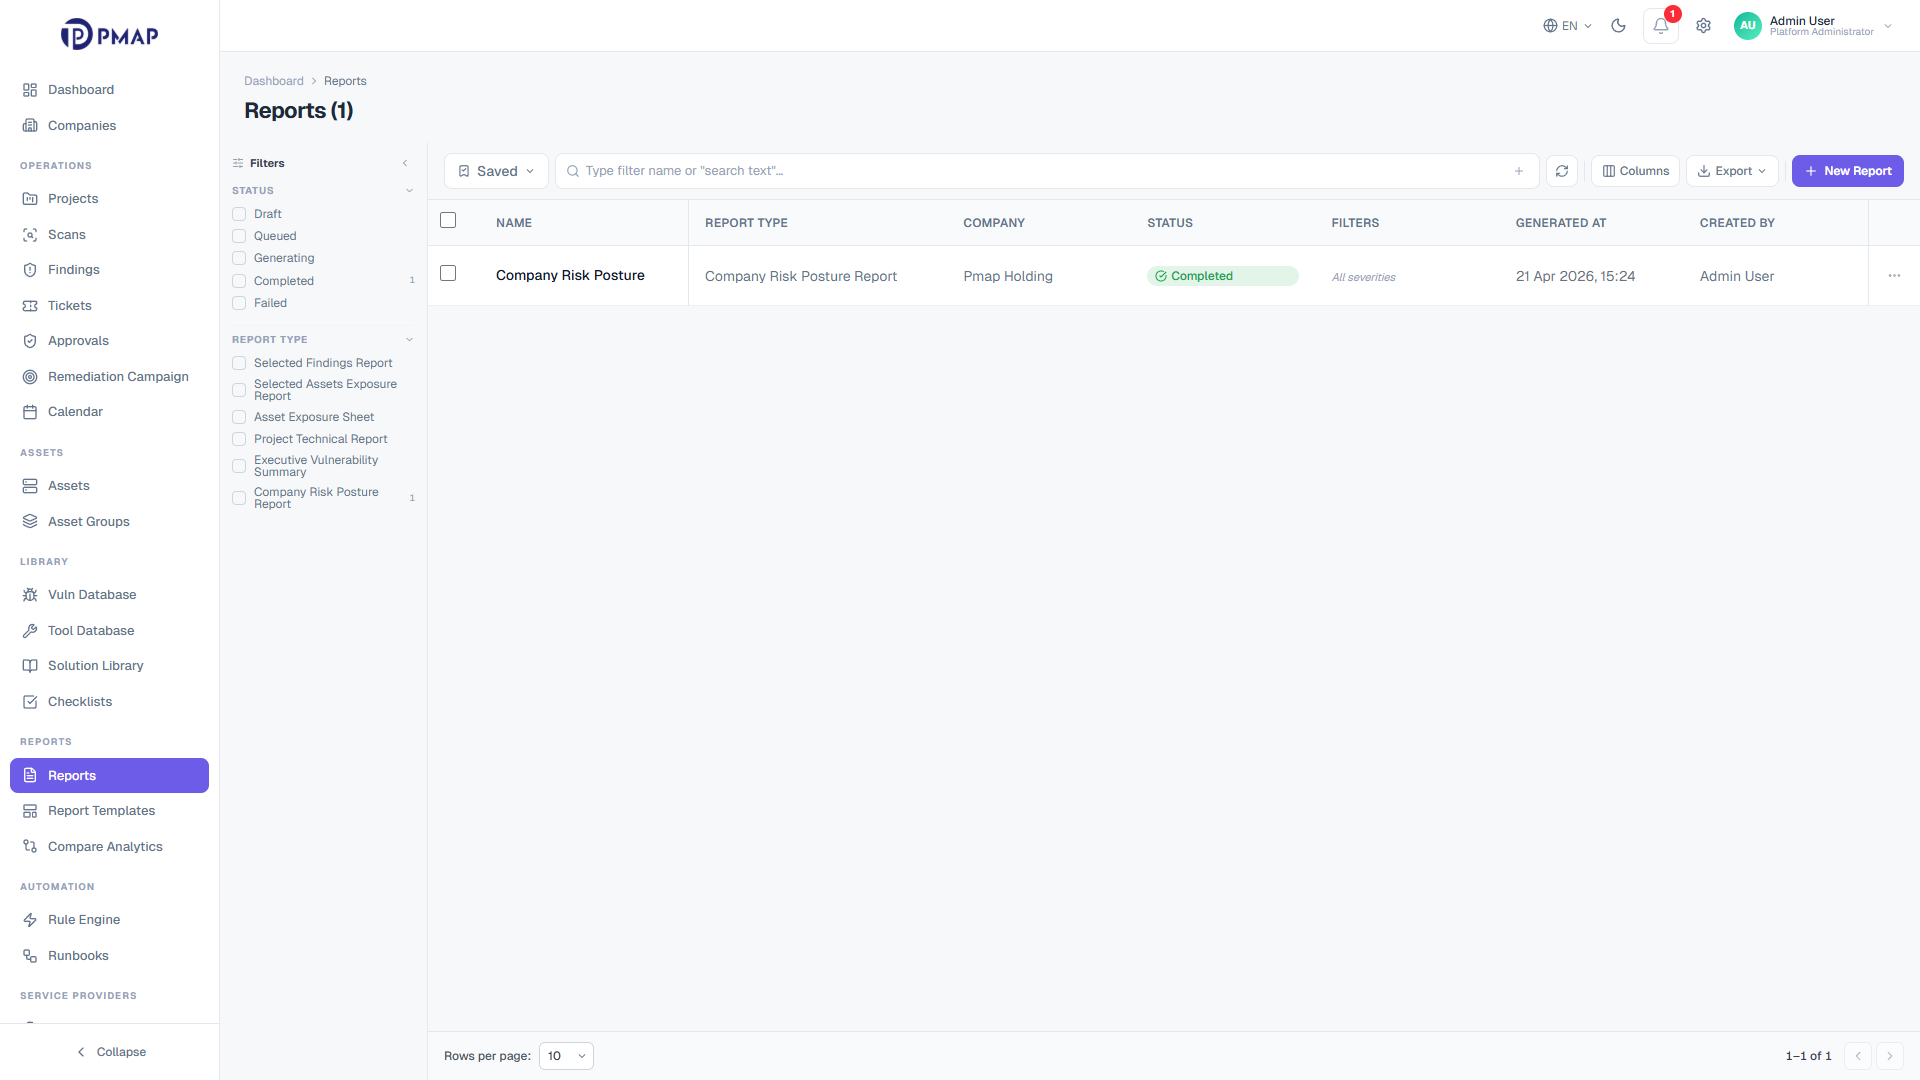
Because every finding lives in one model and every transition is recorded, reporting does not need a separate data pull. SLA status, mean time to remediate, reopen rate, and open-versus-closed trends all draw from the same governed records. The audit trail behind each finding means a number on a dashboard can be traced back to the exact events that produced it, which is what makes the reporting defensible at review time.
SLA breach rate, MTTR, reopen rate, and false-positive rate from one finding model
Per-scan findings delta shows new versus regression versus total by severity
Every status change and rule application is captured in the audit trail
The same governed data feeds dashboards, exports, and program reviews
Three engines do the heavy lifting behind the pipeline. You never have to operate them directly, but understanding them explains why the same input always produces the same governed result.
The correlation engine
Every inbound result runs a 4-case pipeline. It matches on scanner reference, then on fingerprint, reopens a closed finding when one recurs, or creates a new finding when nothing matches. The decision is recorded each time, so deduplication is never a black box.
Triage policy is authored once as named, priority-ordered rules and applied inline at ingest. Each application stamps an override badge on the finding and writes an audit-log entry, so an automated severity or assignment change is always explainable and reversible.
A finding moves through a 9-state machine from intake to closure: open, assigned, in_progress, retest, reopened, not_accessible, closed, false_positive, and accepted_risk. The machine only permits valid transitions, which keeps ownership, SLA, and closure honest at scale.
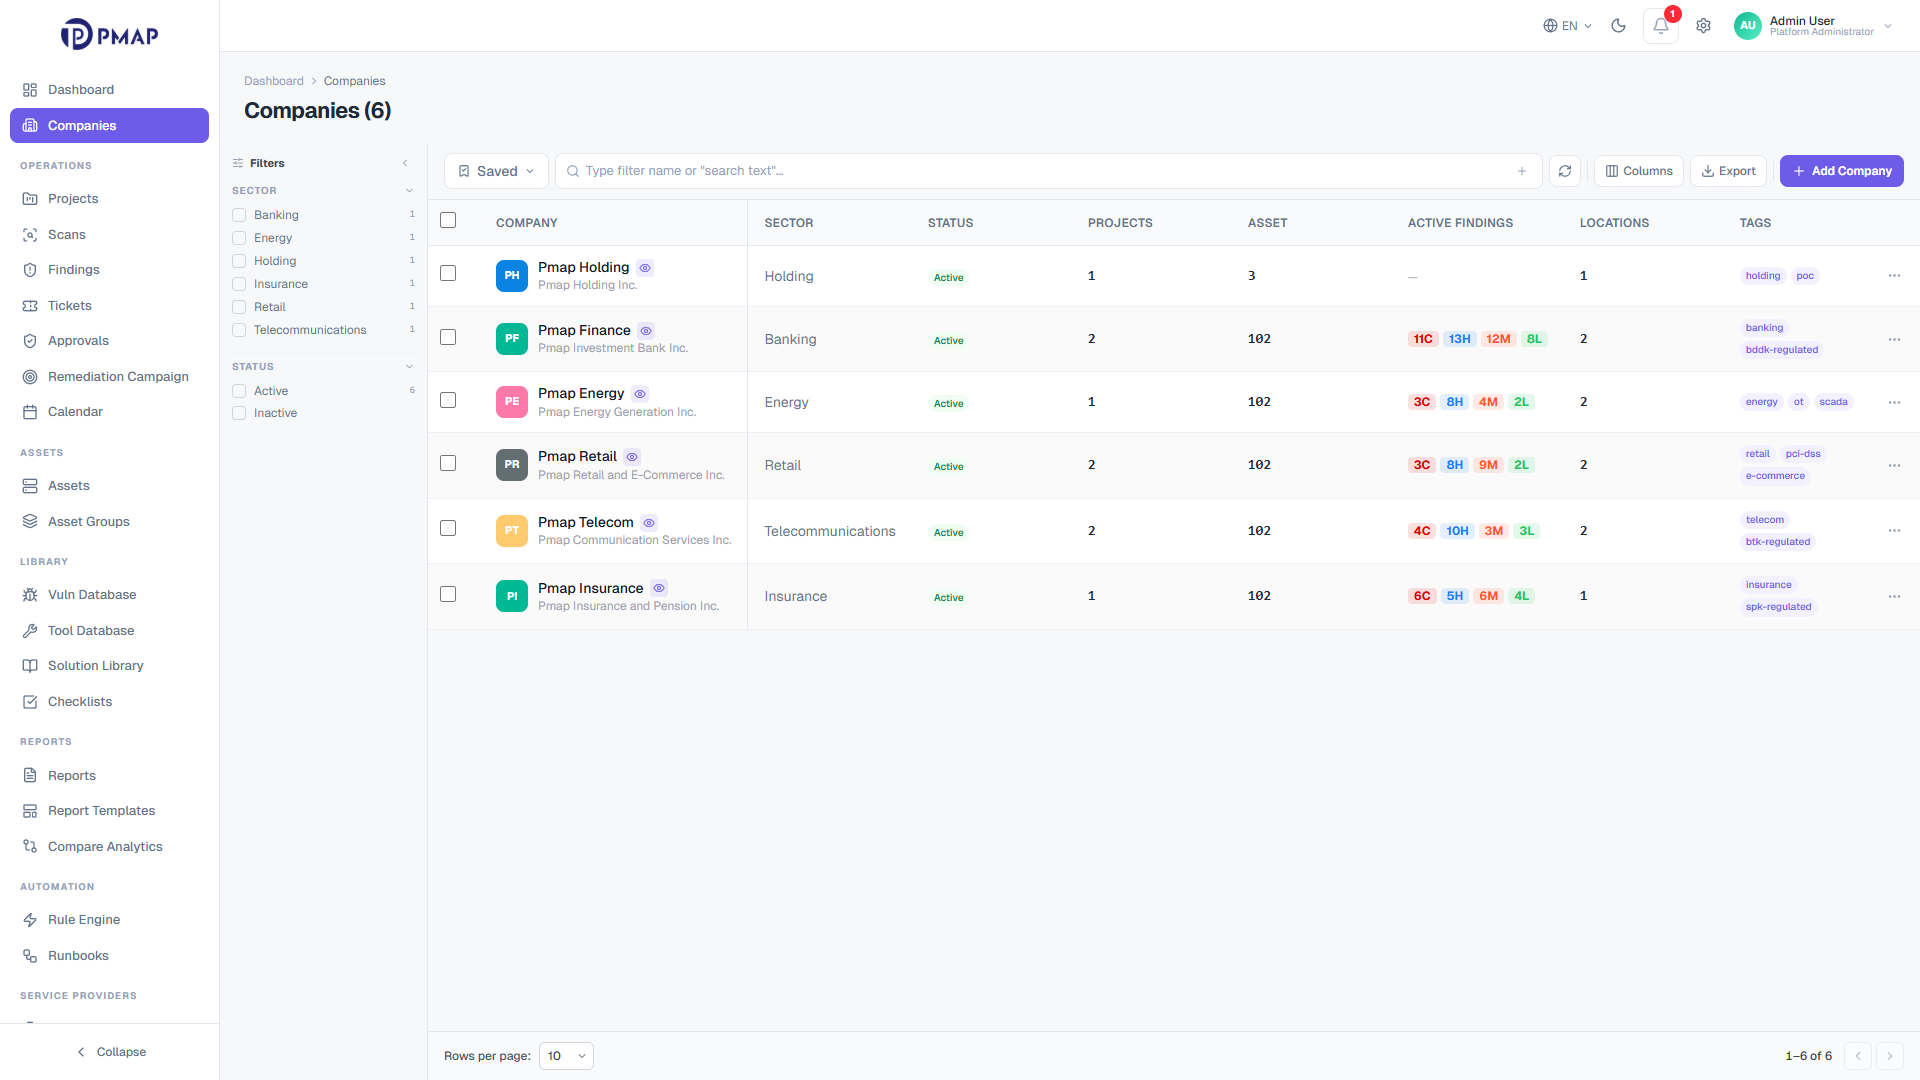
Isolation is not a feature bolted onto the pipeline. It runs through every stage. Each request is scoped from the auth context before any data is read, so a tenant only ever sees its own scans, findings, and reports. RBAC governs who can do what on top of that scope, with a permission matrix of 10 entities across 6 actions, plus project and company-level grants.
Tenant isolation applies by default, with scope enforced on every repository query
Out-of-tenant access returns 404 rather than 403, so UUIDs cannot be enumerated
RBAC resolves a 10-entity by 6-action permission matrix on every authenticated call
Grants can be scoped globally or down to a single project or company
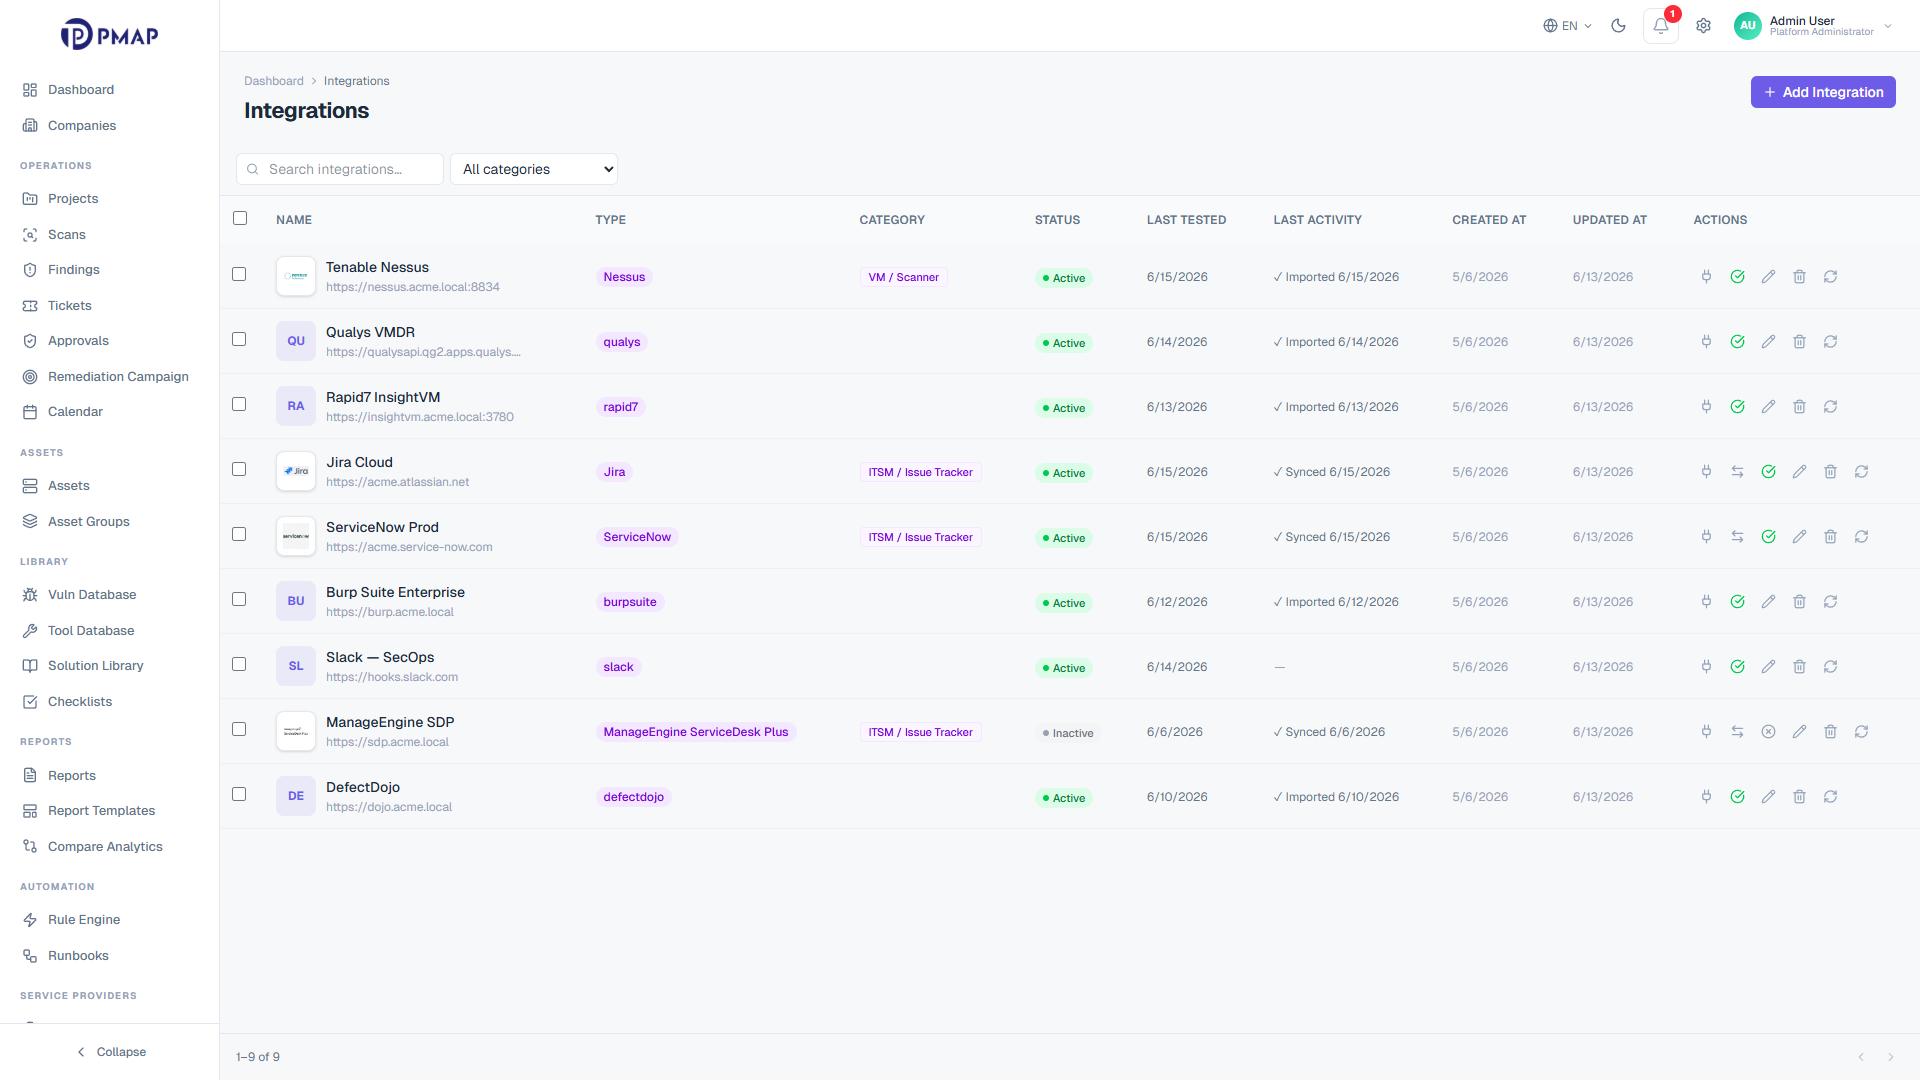
The pipeline is only as good as what feeds it. PMAP connects to 30 vendors across 9 categories: VM scanners, DAST, SAST, SCA, ITSM, CI/CD, CMDB, container, and discovery tools. Ingest connectors pull scan results in at one end, and ITSM connectors push findings out to Jira and ServiceNow at the other, so the same pipeline both consumes and acts on findings.
PMAP ingests scans both manually and through integration-backed connectors that pull directly from connected scanners. A 30-second sync keeps status, progress, and severity counts current, and a 5-minute orphan-adoption sweep automatically pulls in vendor scans that are not yet in PMAP. The result is one scan inventory that mirrors every connected console.
How does vulnerability deduplication work in PMAP?
+
On every imported result, PMAP runs a 4-case correlation pipeline. It looks for an existing finding by the scanner reference key first, then by a SHA-1 fingerprint built from the normalized title, asset, and endpoint. If a match exists it updates or reopens that finding, and only a genuinely new issue creates a new record, so duplicate noise is removed.
How are findings from different scanners correlated into one record?
+
The fingerprint is computed from normalized vulnerability data rather than from any single scanner format. Because the same issue on the same asset produces the same fingerprint regardless of which scanner reported it, results from different vendors collapse into one finding. Cross-scan wave visibility then tracks how often and where that finding has been observed.
How does a finding move from triage to remediation?
+
After correlation, a finding gets governed severity, an enforced status, an owner, and an SLA deadline. Policy rules can apply triage decisions automatically at ingest. From there the finding moves through its status machine toward remediation, and sensitive changes can require four-eyes approval before they take effect.
How does scan to ticket remediation work with Jira and ServiceNow?
+
A triaged finding is linked to a Jira or ServiceNow ticket with two-way status sync, so an update in either system reflects in the other. When a fix is claimed, the finding moves to re-test, and only a passed re-test moves it to closed. Bulk actions let teams ticket large selections of findings in a single operation.
How does PMAP keep data isolated across multiple tenants?
+
Every request is scoped from the auth context before any data is read, so a tenant only sees its own scans, findings, and reports. Out-of-tenant access returns a 404 rather than a 403, which prevents enumeration of records by UUID. RBAC adds a 10-entity by 6-action permission matrix on top of that scope, with project and company-level grants.
How long does it take to set up the PMAP pipeline?
+
Setup time depends on how many scanners you connect and how your tenants and policies are structured. Once a vendor integration is connected, scans start syncing automatically and correlation, triage rules, and reporting apply to findings without per-scan configuration. A demo is the fastest way to scope what onboarding looks like for your environment.
See the pipeline in action
The fastest way to understand how PMAP works is to watch a real finding travel the pipeline. Bring your scanners and tenants, and see ingest, correlation, triage, and remediation on your own data.
This site uses cookies to provide you with a great user experience. By continuing to use our website, you consent to the use of cookies. To find out more about the cookies we use, please see our Privacy Policy.